Product Design Work at MVP
MVP operates as a Software as a Service (SaaS) firm specializing in sponsorship measurements within the sports industry. In my role as a senior product designer, I have conceptualized various approaches to enable users to seamlessly explore and delve into a diverse set of social and broadcast data, facilitating the extraction of valuable insights.
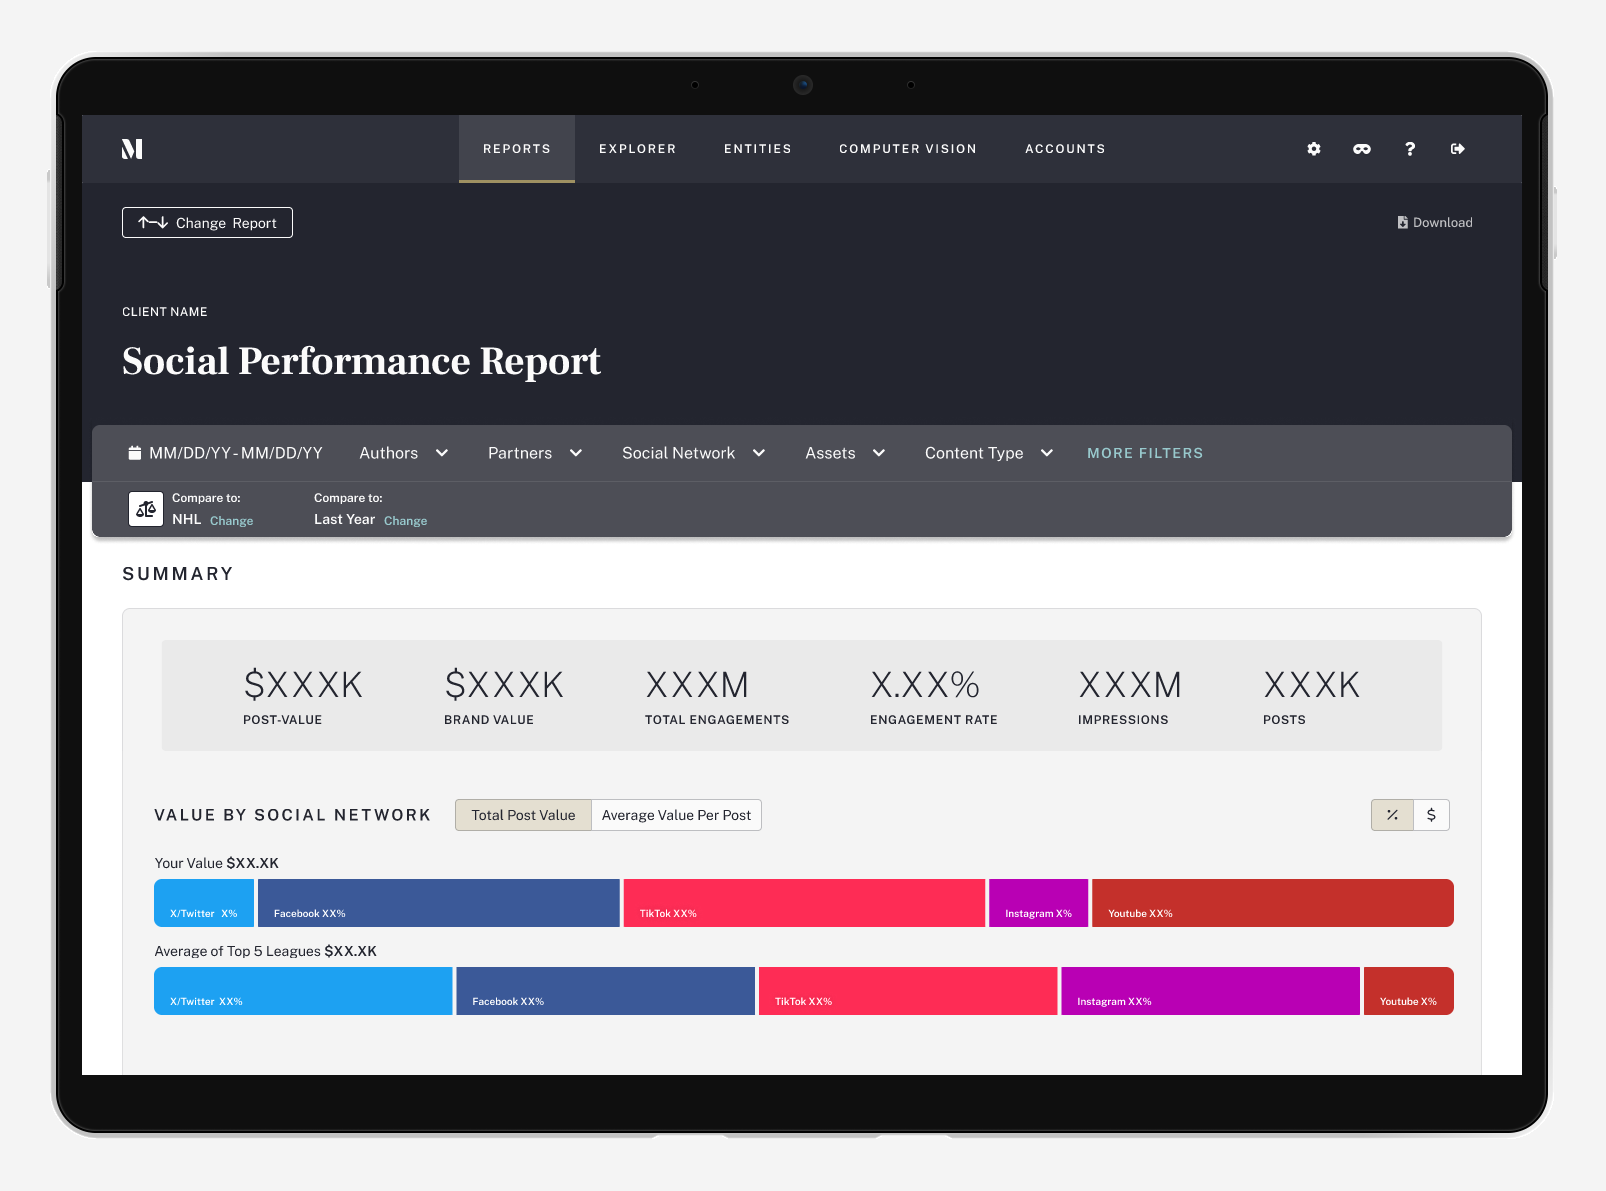
Empowering Users with Chiclet Filters
Users can generate a social report and apply a chiclet filter within it. This chiclet filter allows users to seamlessly filter through the report based on Brands, Assets, and Properties.
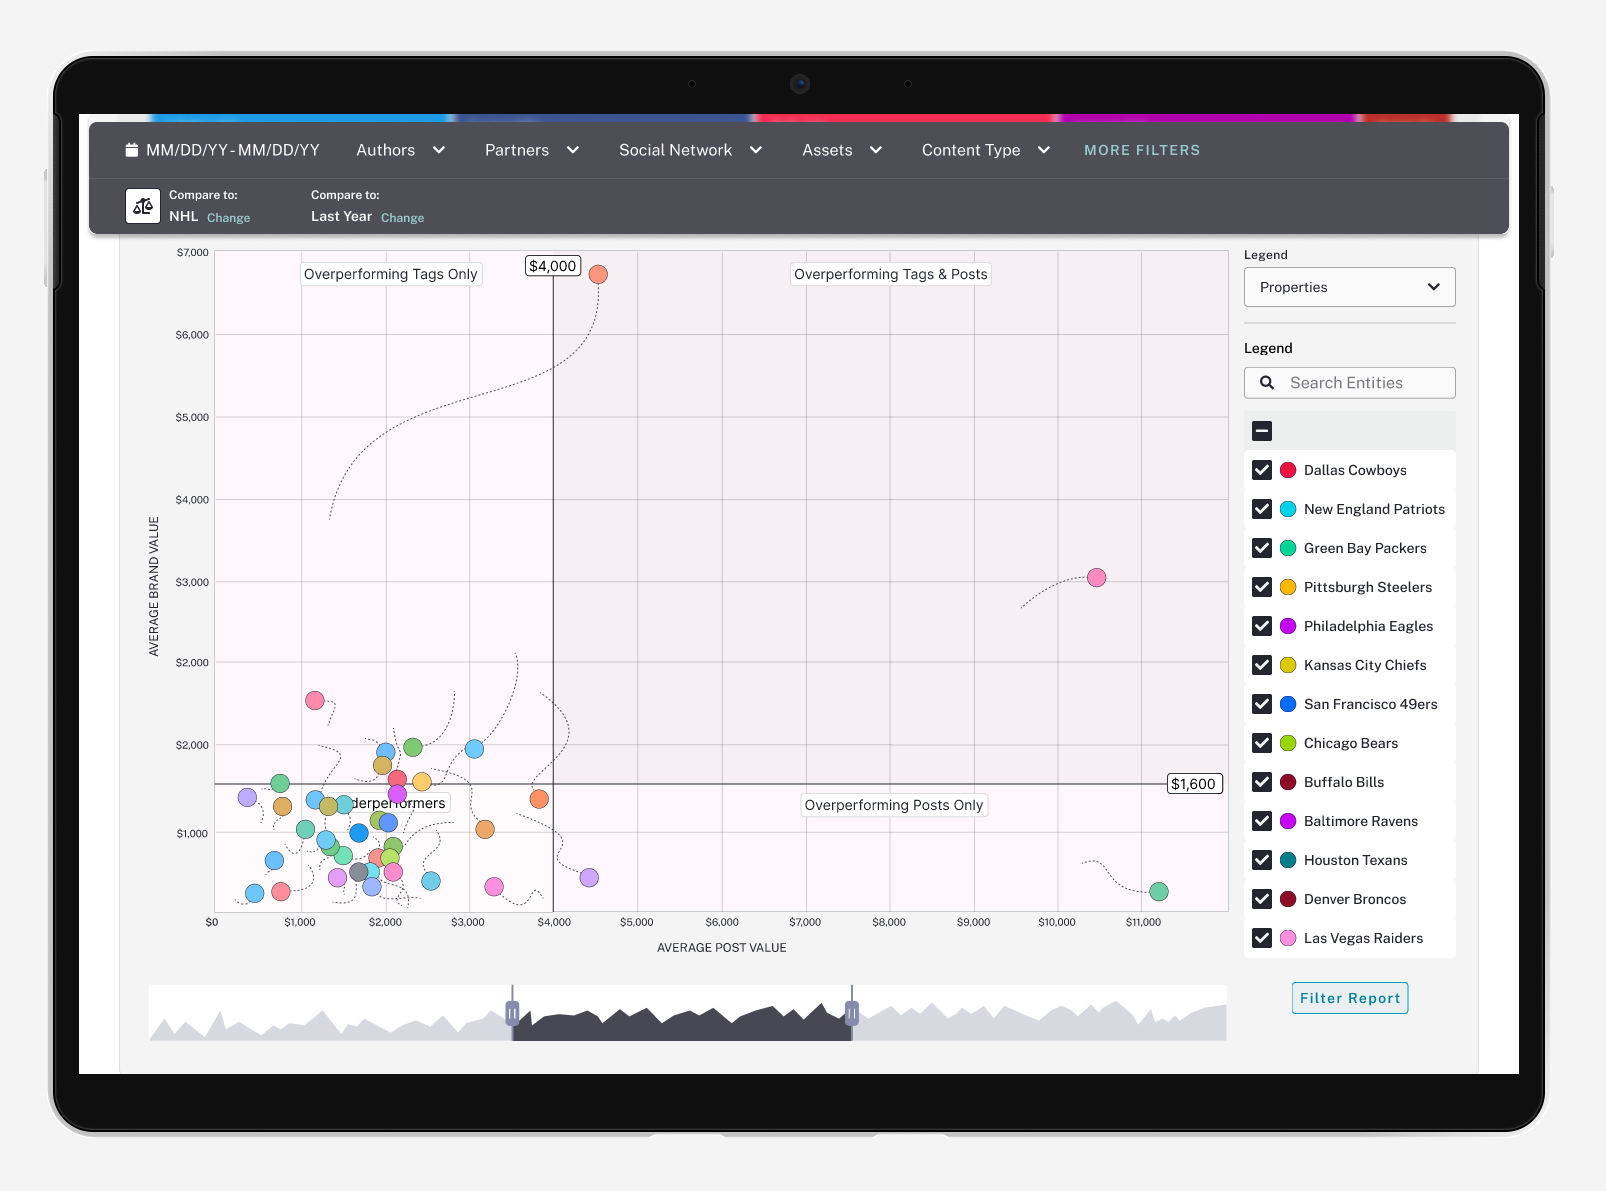
Benchmarking and Comparison Insights: Unveiling Data Trends
Users can explore data via a comparison or distribution chart. In the comparison chart, users can analyze categories in a scatterplot view, identifying over or underperformers. The quadrant can be adjusted to benchmark categories against averages like the NFL or Brand industry average. Data scope flexibility is provided through a scrubber within the search parameters.
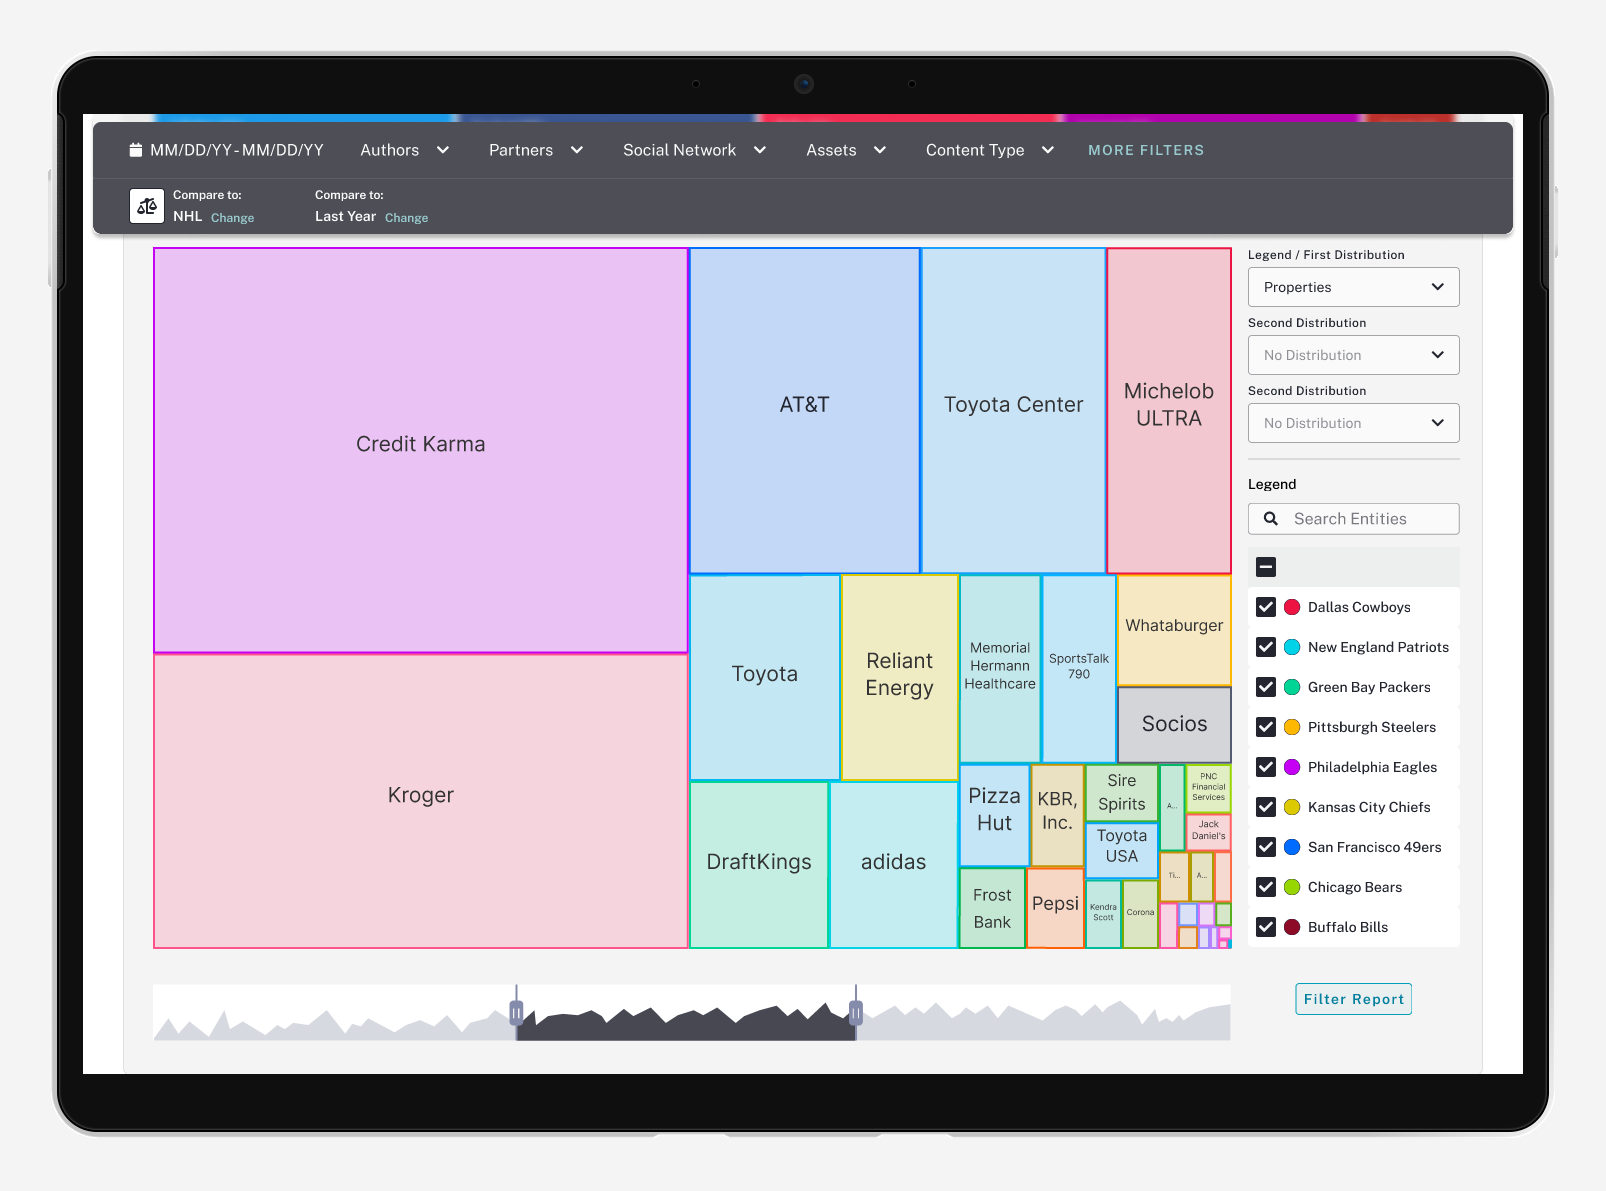
Navigating Categories and Unveiling Detailed Insights
The distribution chart illustrates categories, allowing for a comparison of their total values. The tree map design enables the distribution of parts across up to three levels, providing users with the functionality to drill down into more detailed insights of how a value is build.
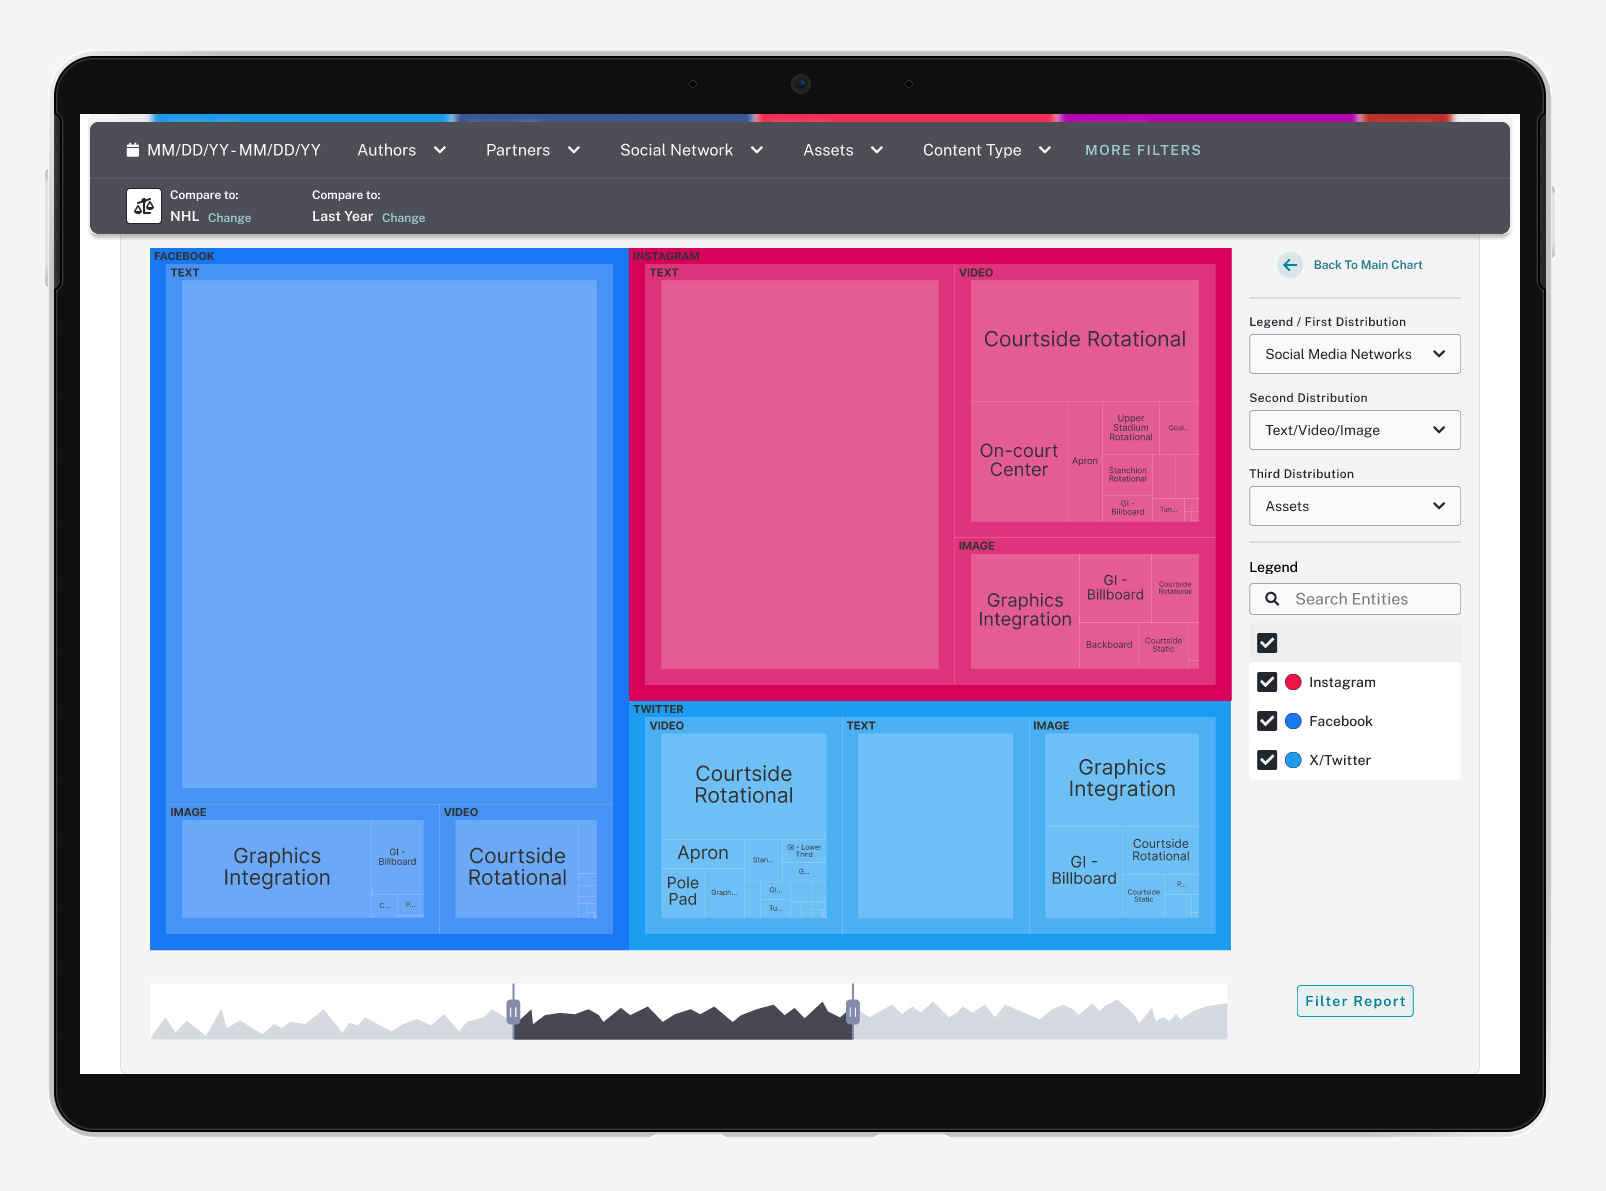
Navigating In-Depth Insights and Filtering Reports with Chiclet Controls
Upon selecting a category in either the explorer chart or the distribution chart, the user will be directed to a subsequent treemap. Here, users can delve even deeper into the details. In all three charts, users have the capability to apply their selections as chiclet filters, effectively filtering the entire report based on their chosen criteria.
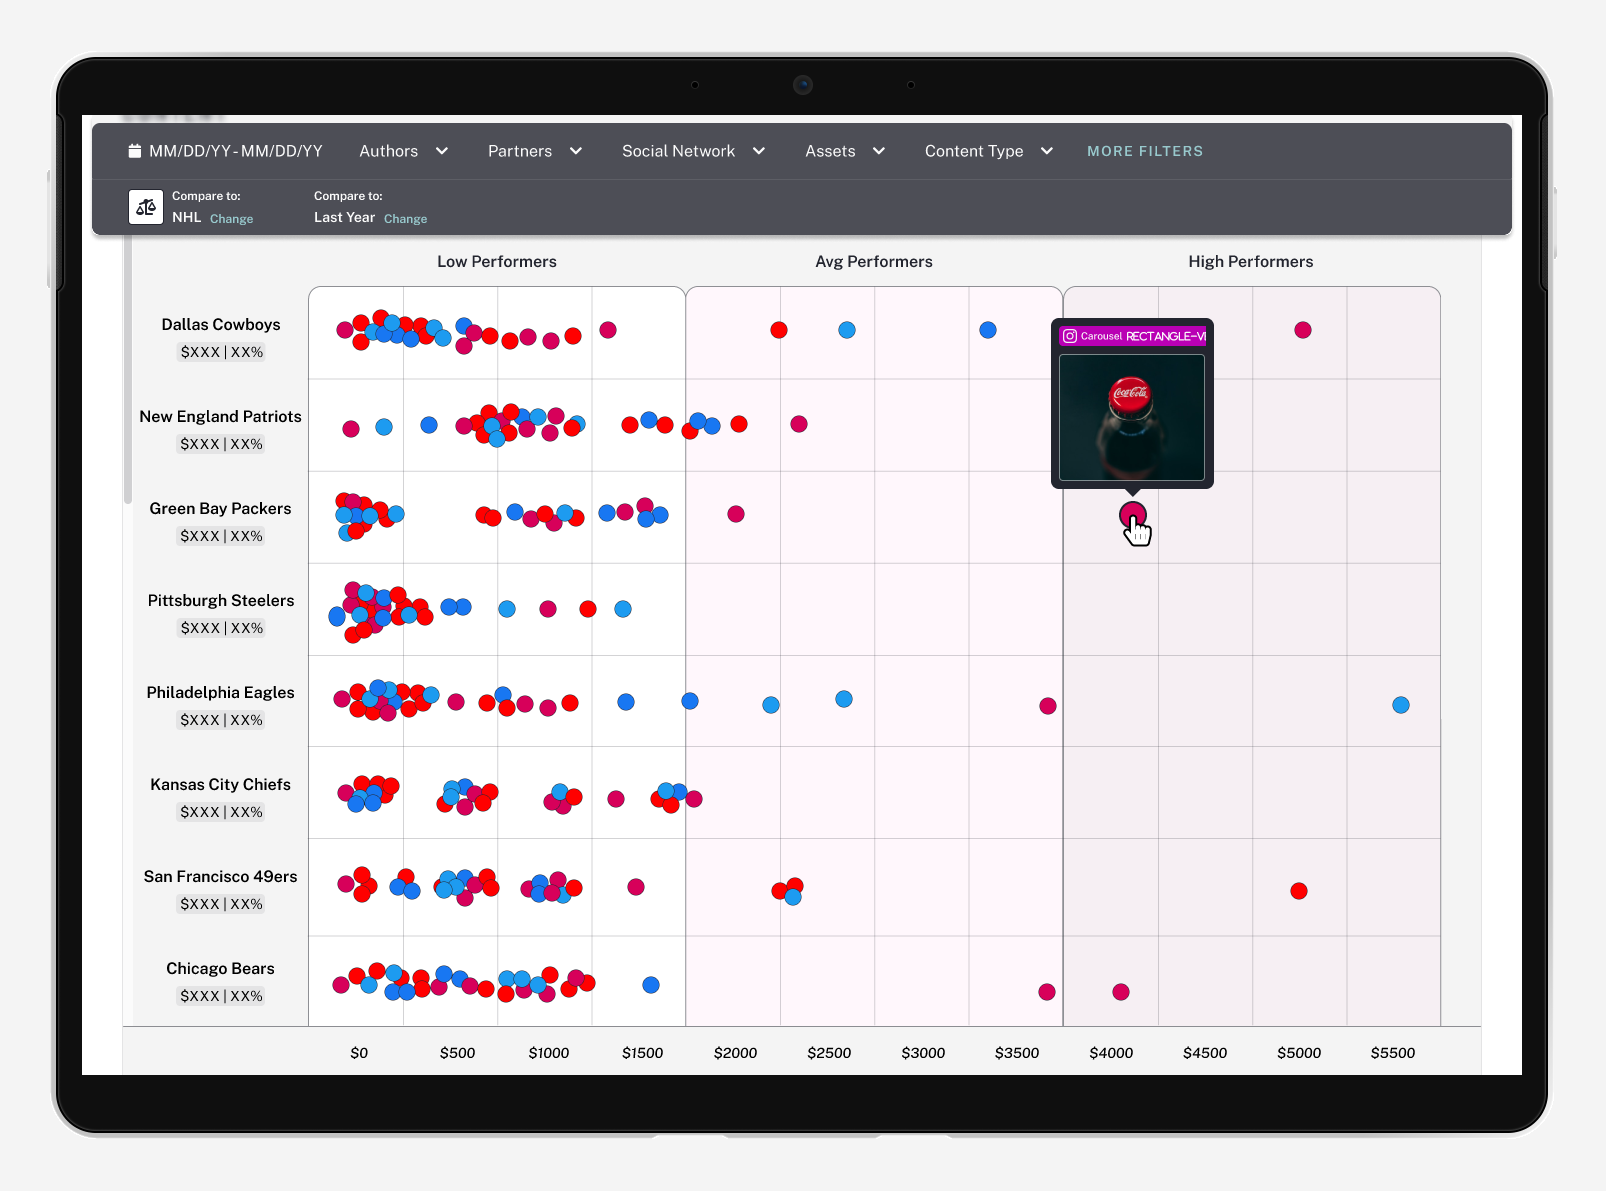
Post-Level Analysis
All report values are derived from posts created by properties (teams, influencers) for brands. In this view, users can examine data at a post level, choosing between masonry view, table view, or dataviz view. The Dataviz view enables users to identify high-performing posts per team. Clicking on these data points opens a modal, allowing users to explore posts in more detail. Users can precisely analyze which tags generated specific values in each post.
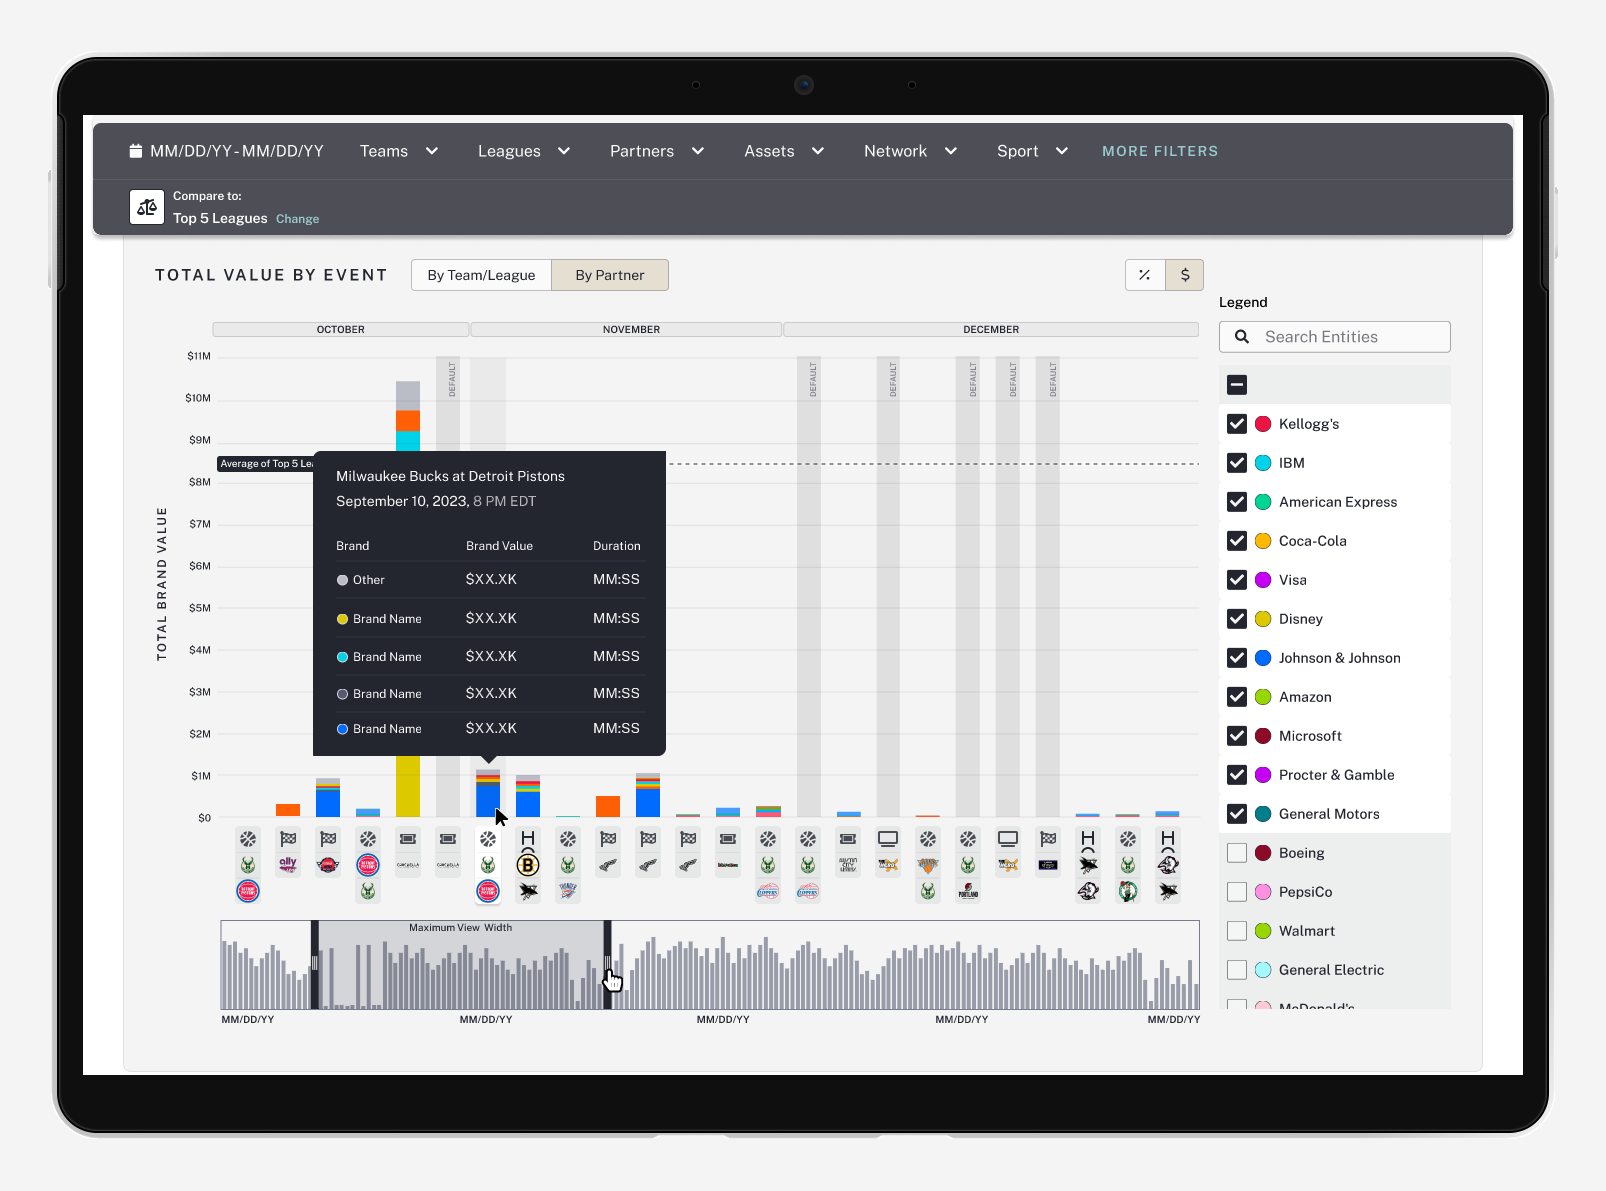
Unveiling Match-Specific Insights and Value Distribution
In addition to social data, users can delve into broadcast data, examining different matches to understand which brands generated specific brand values during these events. Users have the flexibility to view this information either as totals or as percentages.
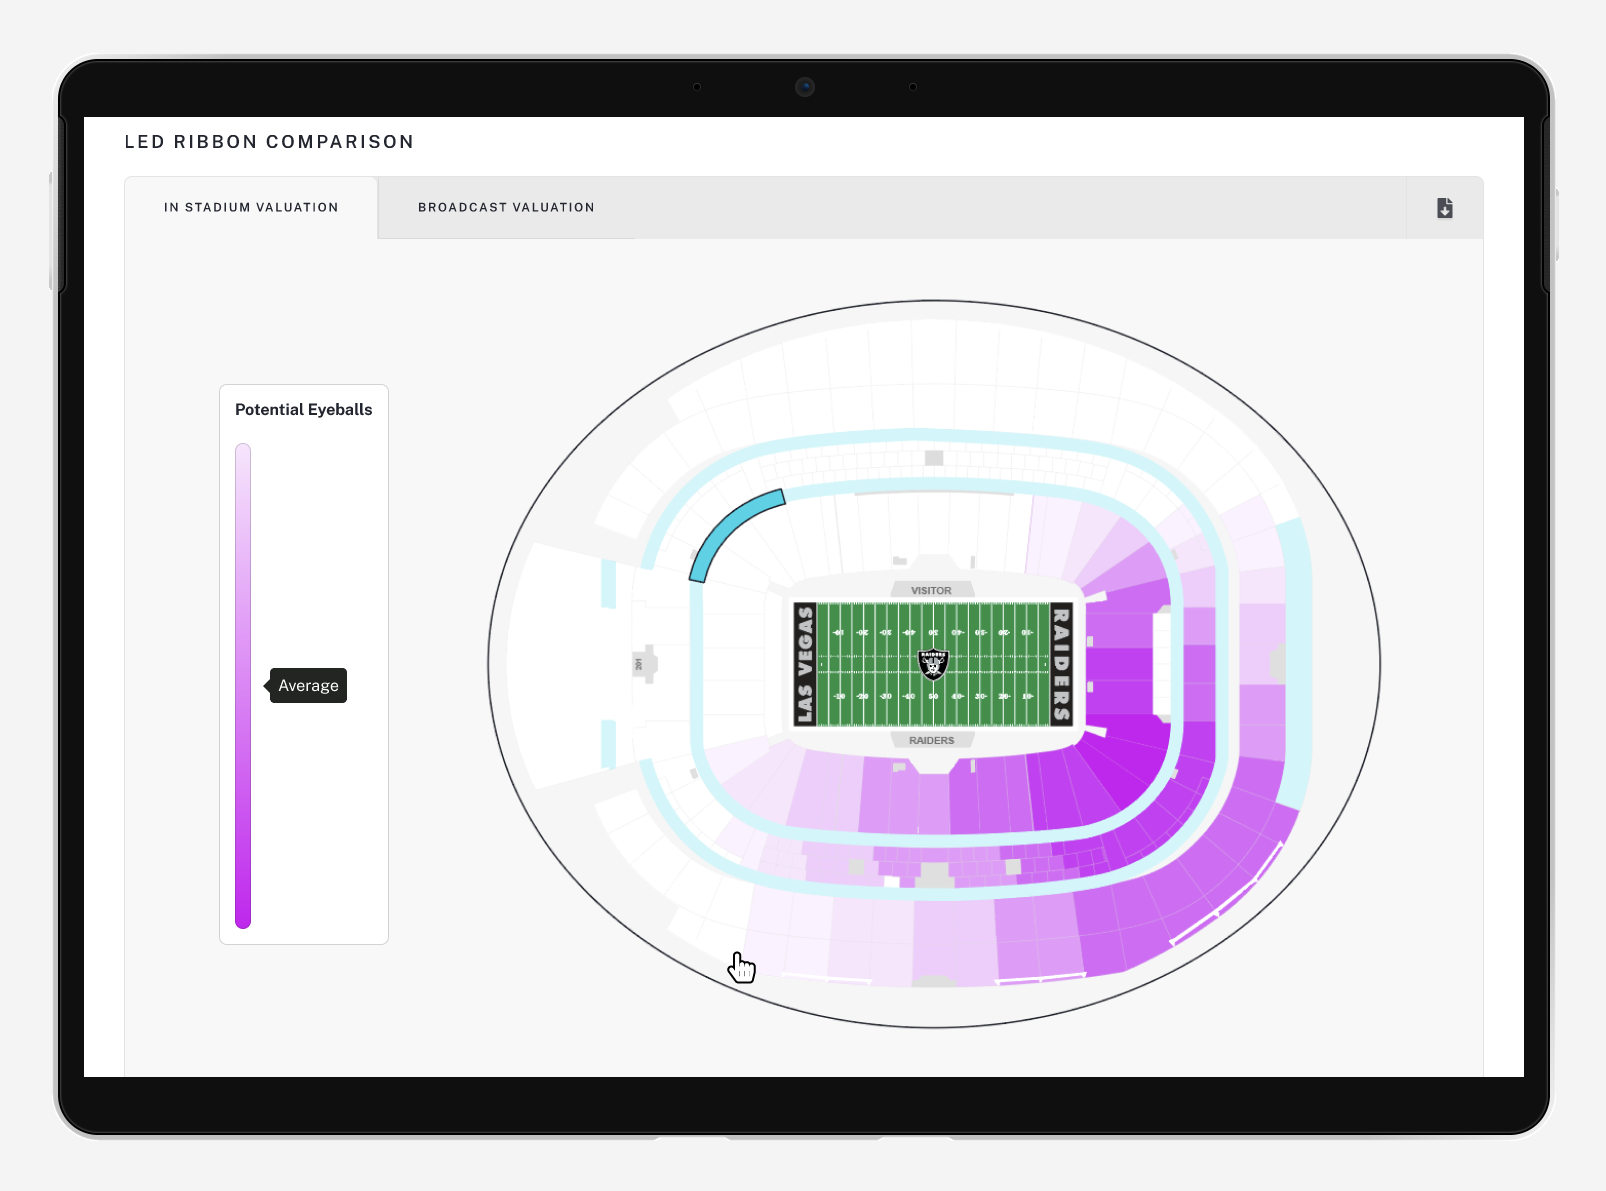
Evaluating LED Ribbon Eyeballs in Stadiums
In this interactive chart, users can assess the potential viewership within a stadium for a section of LED ribbon, estimating the impact it could have prior to making a purchase decision.
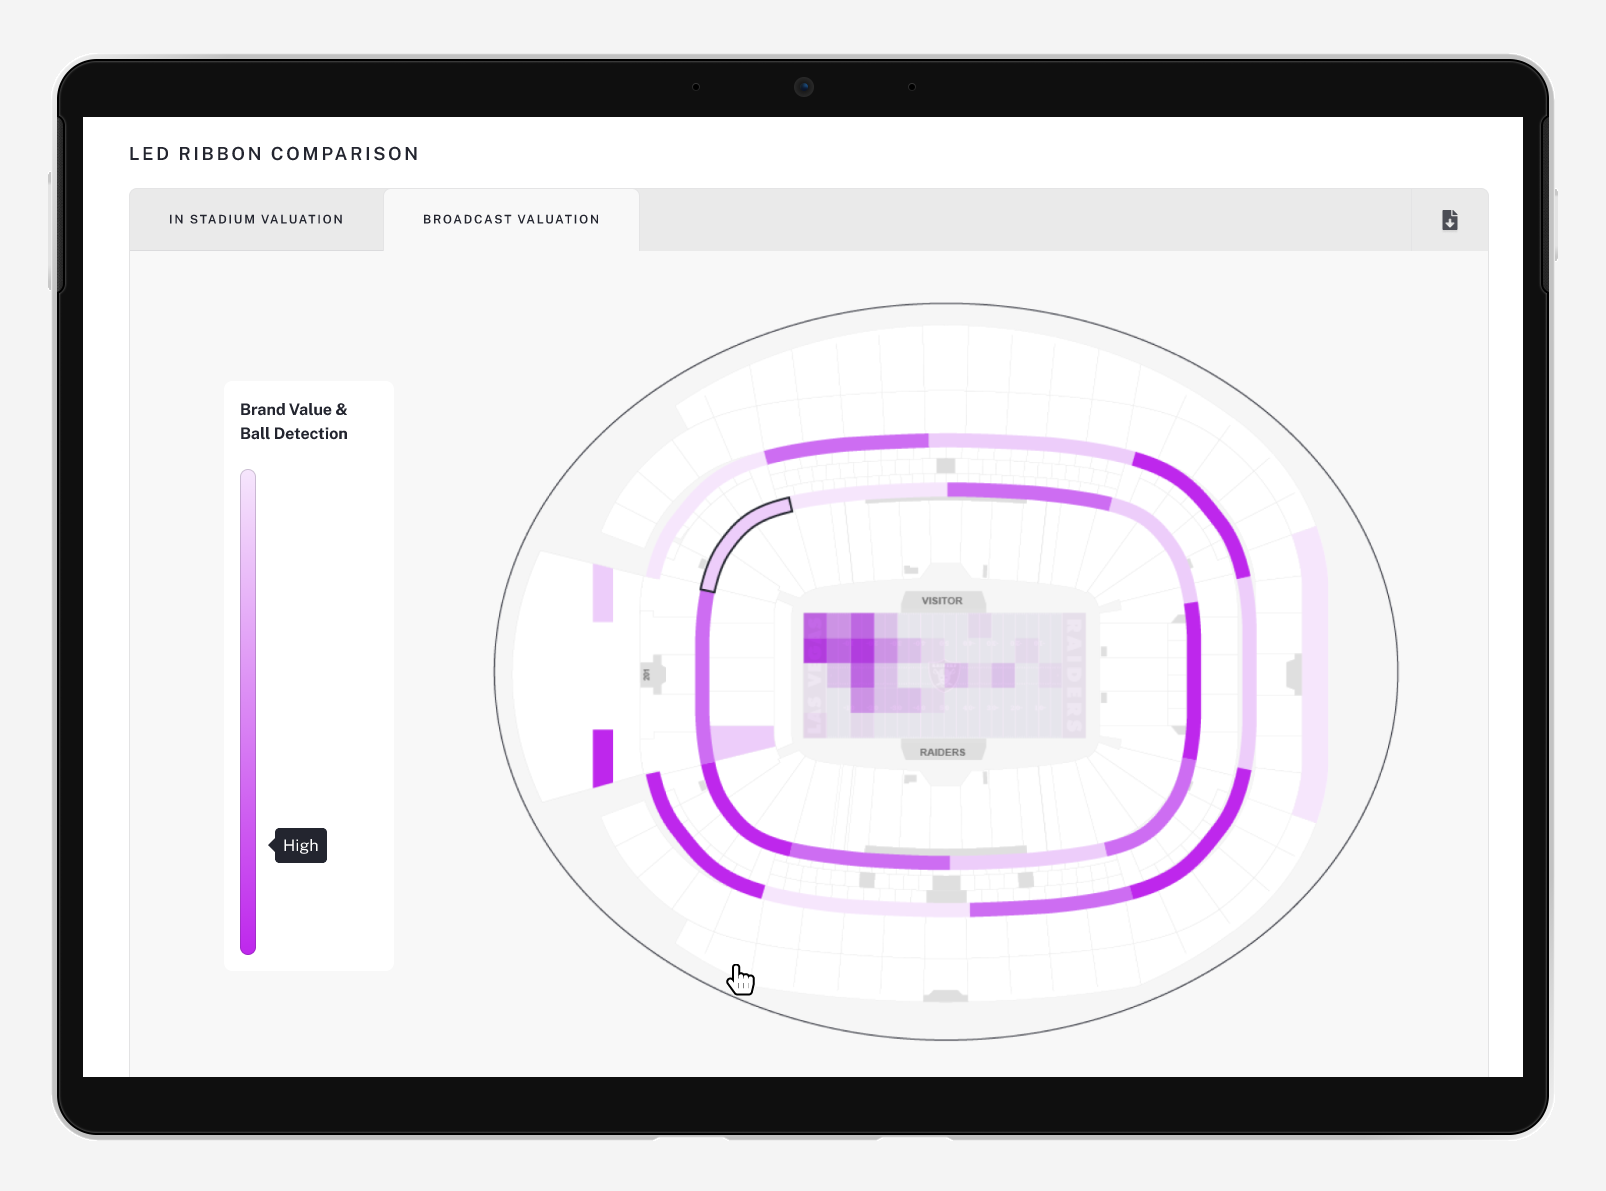
Analyzing LED Ribbon Detection and Team Dynamics
Beyond in-stadium viewership, users can explore broadcast viewership. Through detailed analysis, users can pinpoint when the LED ribbon was detected and track the ball's location during that period. Overlaying this data with team information allows for conclusions on which parts of the ribbon are more likely to be detected when a specific team is in play.